Latest Work
mPACT2WO industrial IoT platform, Molex, Koch Industries.2019-2026
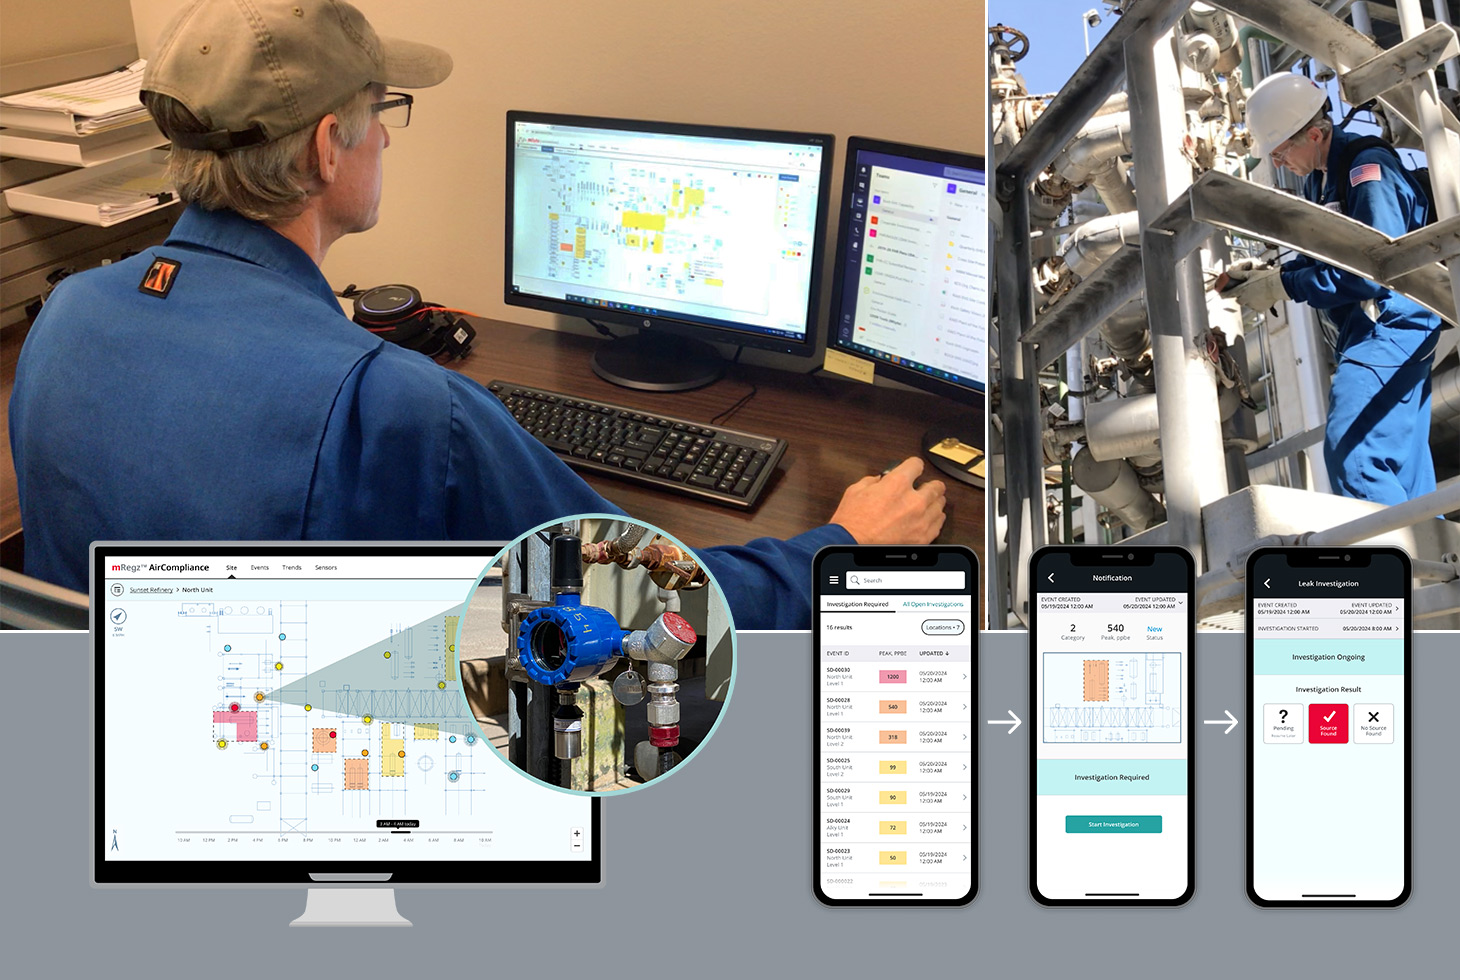
Flagship product of the mPACT2WO platform - mRegzTM AirCompliance app, Emissions Monitoring solution for refinery and pipeline operators to monitor and manage emissions in real-time.
Disclaimer: Due to IP protections in place, I am limited in what I can share publicly. All visuals shared on this page are from officially published mPACT2WO marketing and promotional materials.
ProjectmPACT2WO by Molex is an IIoT (Industrial Internet of Things) platform offering sensor-based early detection solutions for emissions and corrosion monitoring in oil & gas, petrochemical and manufacturing industries. The solutions help operators of refineries, pipelines and plants identify problems early and fix them fast.
My Role & ContributionsAs the lead designer for mPACT2WO platform, I owned UX strategy and execution for all its web and mobile applications - from early pilots through market adoption. Starting out as the 'UX team of one', I laid the UX groundwork, established a design system and carried out end-to-end UX/UI design from concepts to launch. Since 2022, I led a small team of exceptionally talented designers and technologists, while remaining a strong individual contributor.
I focused my work on delivering simple user experiences while supporting complex customer needs. For example, the mobile app I designed makes it easy for refinery operators to document gas leak search and repair in often hard field conditions, while following complex EPA compliance requirements. I delivered operational dashboards that equip site managers with actionable insights and save them time, systems to track compliance tasks with clarity and ease, app navigation to simplify users' path to action. I created the core emissions data visualization interface that effectively translates complex scientific algorithms into actionable visual information for operators to quickly locate and fix gas leaks. It is now the product's flagship feature that earned a published patent.
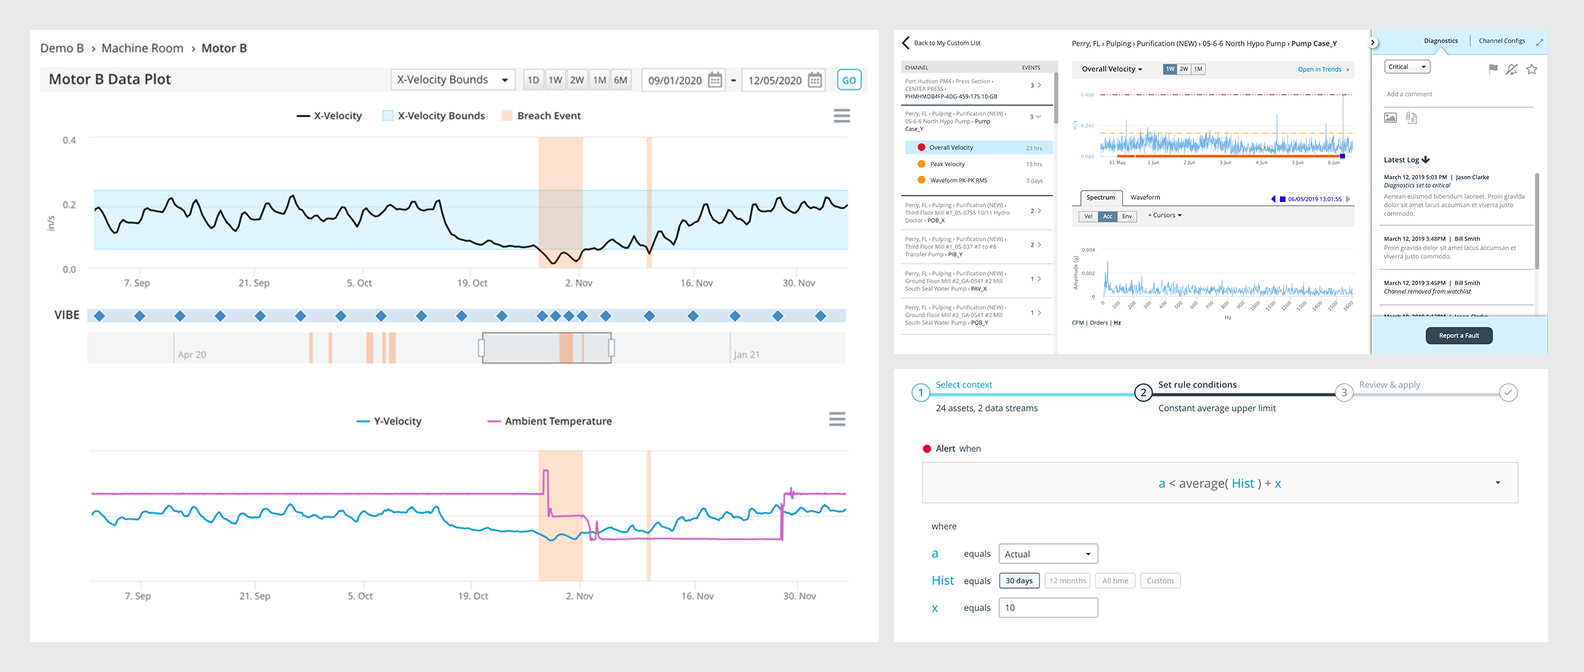
Exploratory data visualization interfaces for emissions monitoring

Snippets of interactive data visualization interfaces for the Emissions Monitoring product that I designed, built and shipped.
Exploratory data visualization is one of my favorite areas of design. I have a deep interest in how complex data can be made accessible and meaningful through visual representation. In the mPACT2WO platform, I designed and developed interactive data visualization interfaces that help field operators quickly identify and resolve gas leaks in real-time, and allow site managers to evaluate operational status, explore historical data patterns and make informed decisions.
Tech Stack: Leaflet.js web mapping library with D3.js
Product Design
REMEDI medical device data analytics platform, Purdue University. 2015-2018
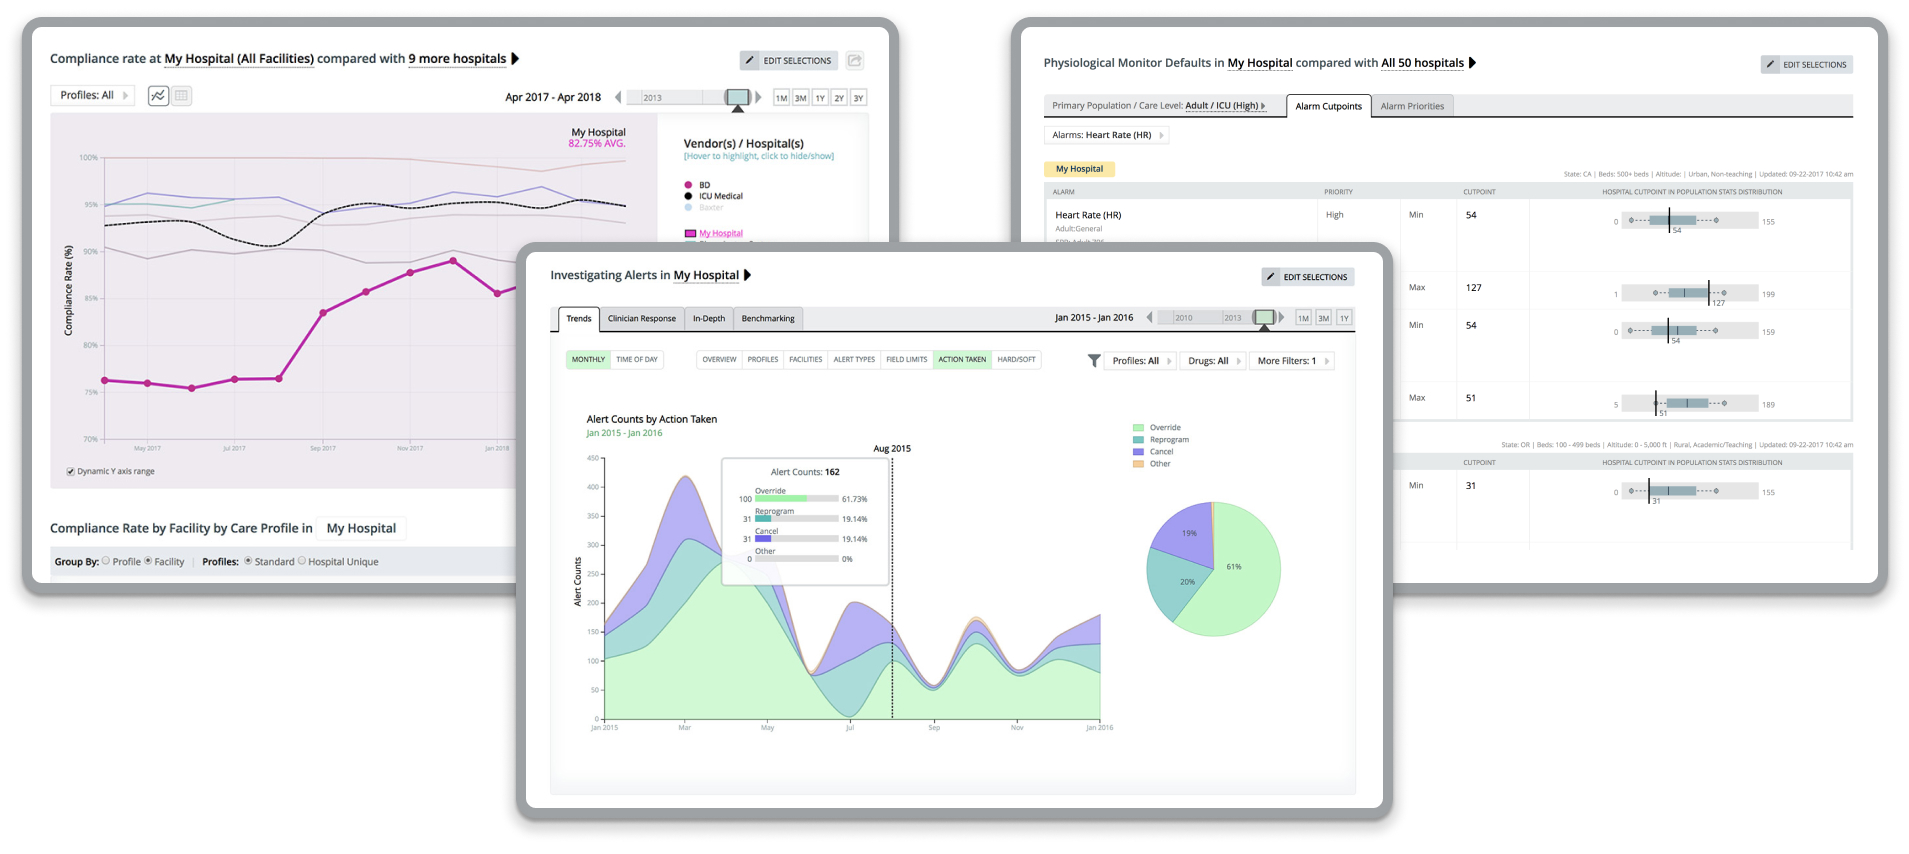
A suite of data analytics web applications on the REMEDI medical device data sharing platform serving clinicians and hospital administrators. My design end-to-end, including the custom D3-based visualization library.
Project REMEDI was Purdue University's evidence-based community of practice for medical device informatics aimed at patient safety and medication quality. Latest REMEDI applications were developed and launched in 2015-2018. In 2022 REMEDI platform was acquired from Purdue University by Bainbridge Health.
Short REMEDI walkthrough (video) | In-depth REMEDI walkthrough (video)
My WorkAs a UX Architect, I led end-to-end UX/UI design of revamped REMEDI platform and all its new data analytics applications. With the new experience design, REMEDI's customer base tripled in size in 3 years to serve over 400 hospitals across 32 US states and internationally.
Designed intuitive data analytics applications navigating ambiguity of innovative product and complexity of irregular, multi-variant data from hundreds of hospitals. Developed design system and D3.js visualization library scalable across platform. Carried designs from concept to high-fidelity prototypes ready for React.
REMEDI platform. Infusion Pump Drug Limit Libraries tool
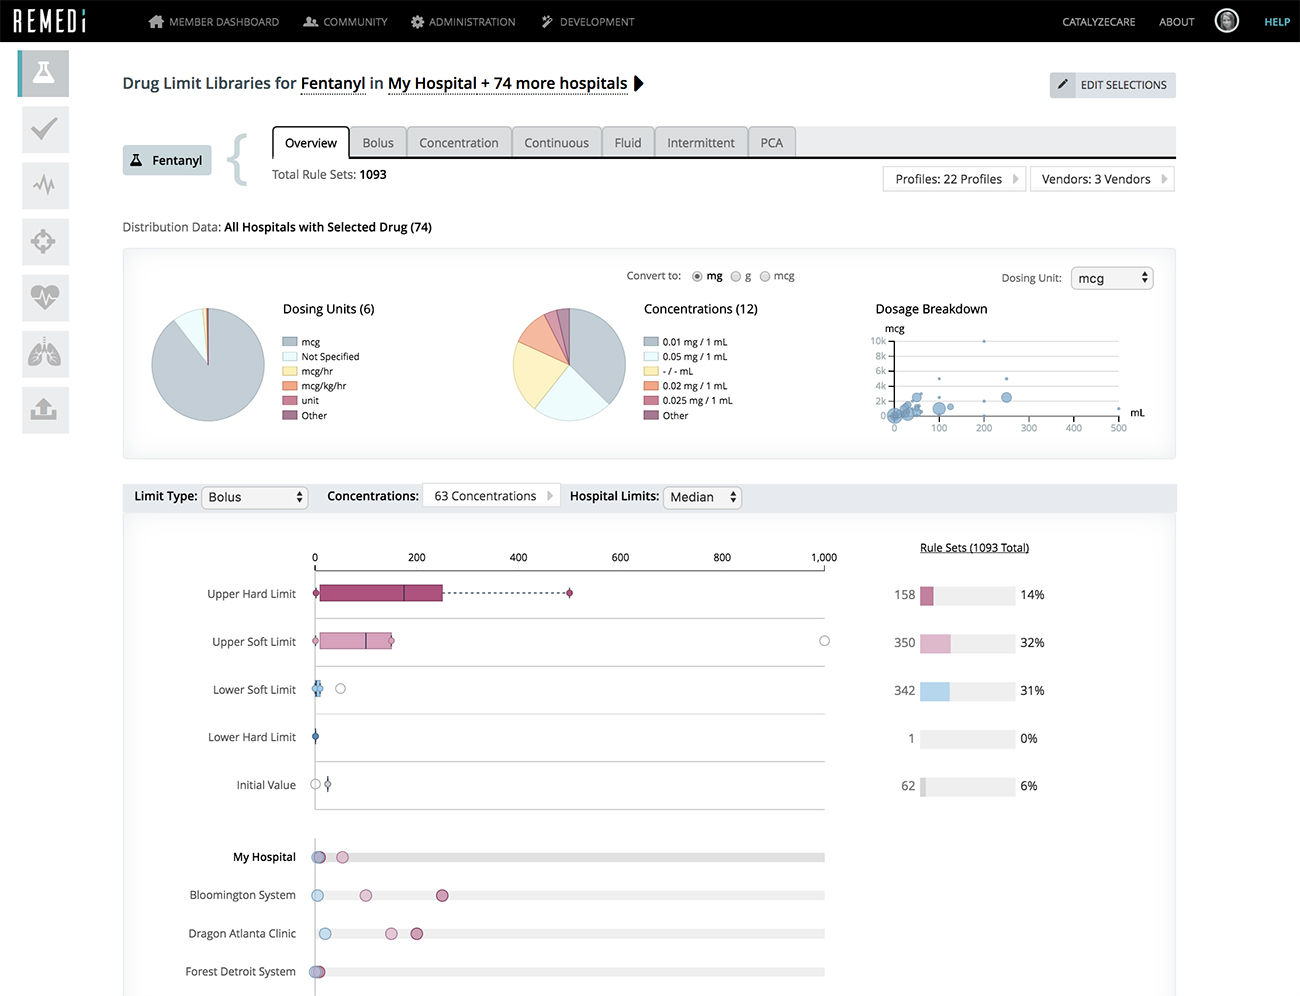
Drug limit library database and analysis tool, core feature of REMEDI platform, helps clinicians make decisions on smart pump settings for improved patient safety.
UsersHospital pharmacists and nurses, members of REMEDI.
User TasksView common concentrations, dosing units and dosage for a particular drug or fluid; compare hospital settings on infusion pumps to other hospitals.
My WorkEnd-to-end design of the app, from initial data mining, flows to working prototypes. Visual, interaction, informational design.
Development: HTML, CSS and JavaScript coding of the interactive prototype. D3.js coding of the chart library. React + ClojureScript templates. Technical integration with the HUBzero platform for scientific collaboration.
Administrative module for REMEDI platform to manage member access and app configurations.
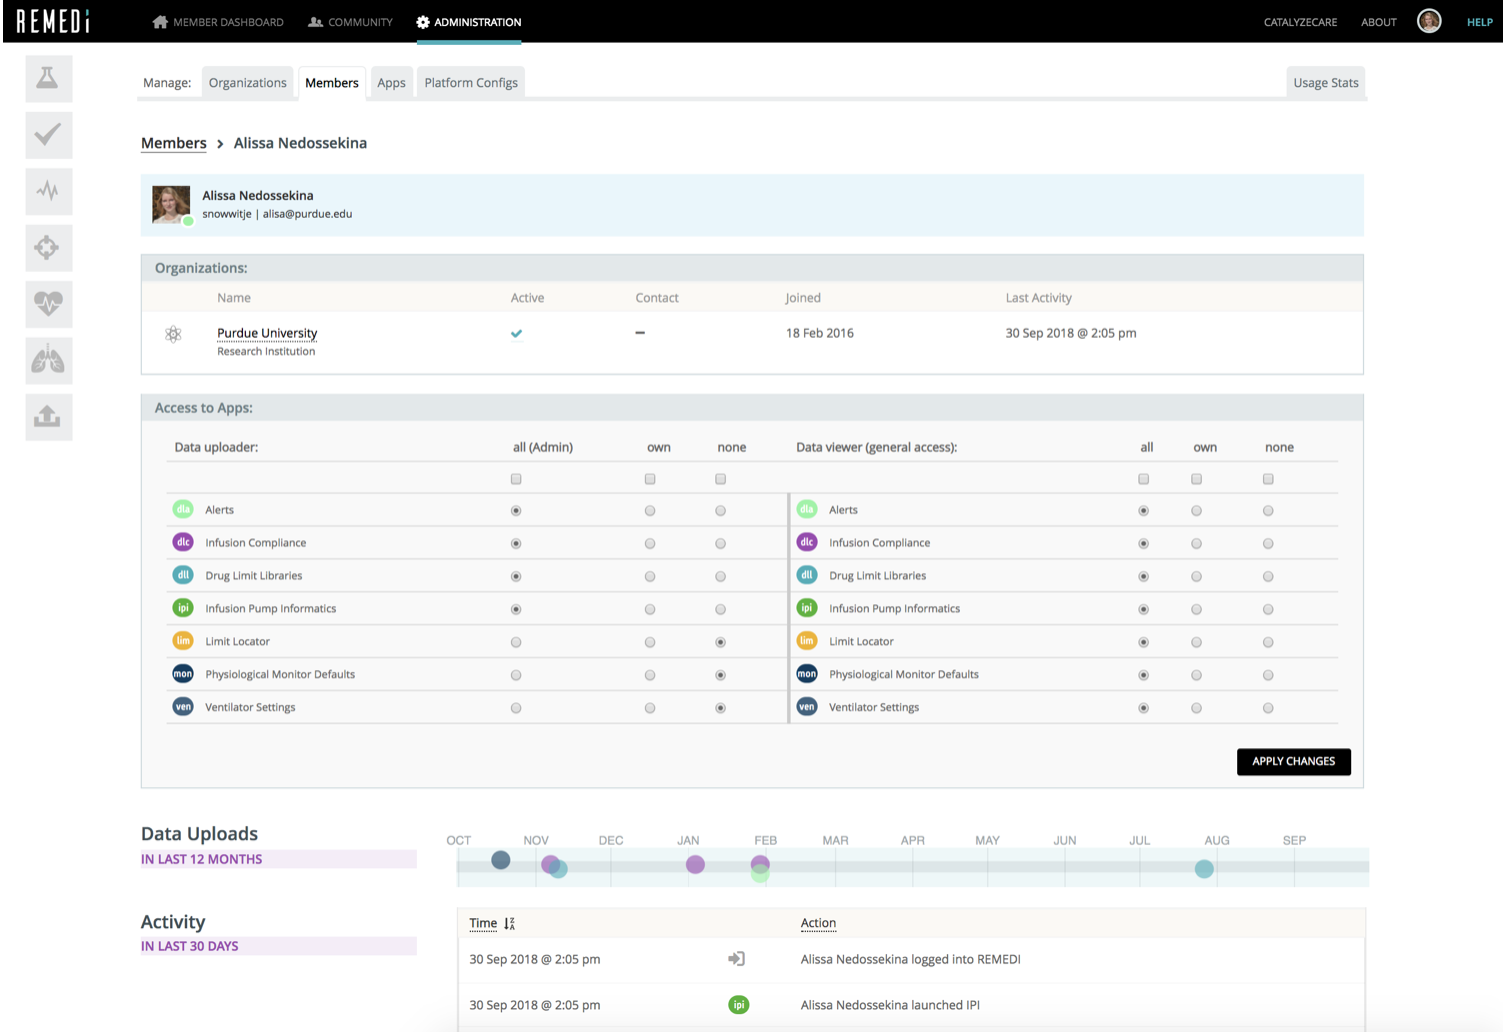
My WorkEnd-to-end UX/UI design from research to implementation, including the back-end development and technical integration with the HUBzero platform for scientific collaboration.
Sensorcon Protector web and mobile apps.2021-2023
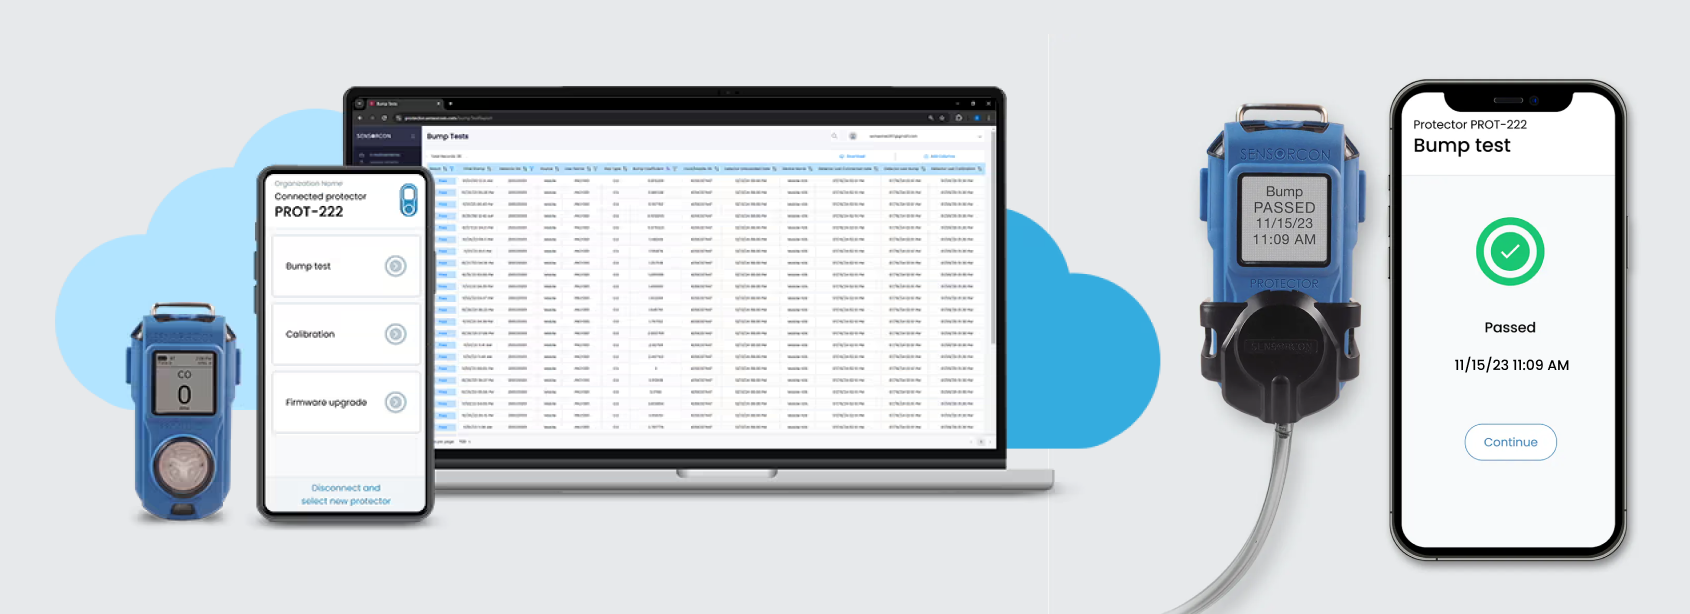
My WorkDirected design of the responsive web app to manage a fleet of Sensorcon Protector devices. The app provides a centralized interface for monitoring compliance data and managing all devices in the fleet. Designed a standalone mobile app to support device management - calibrations, bump tests and firmware updates, focusing on ease of use and interface clarity.
HUBzero open-source platform for scientific collaboration, Purdue University. 2010-2015
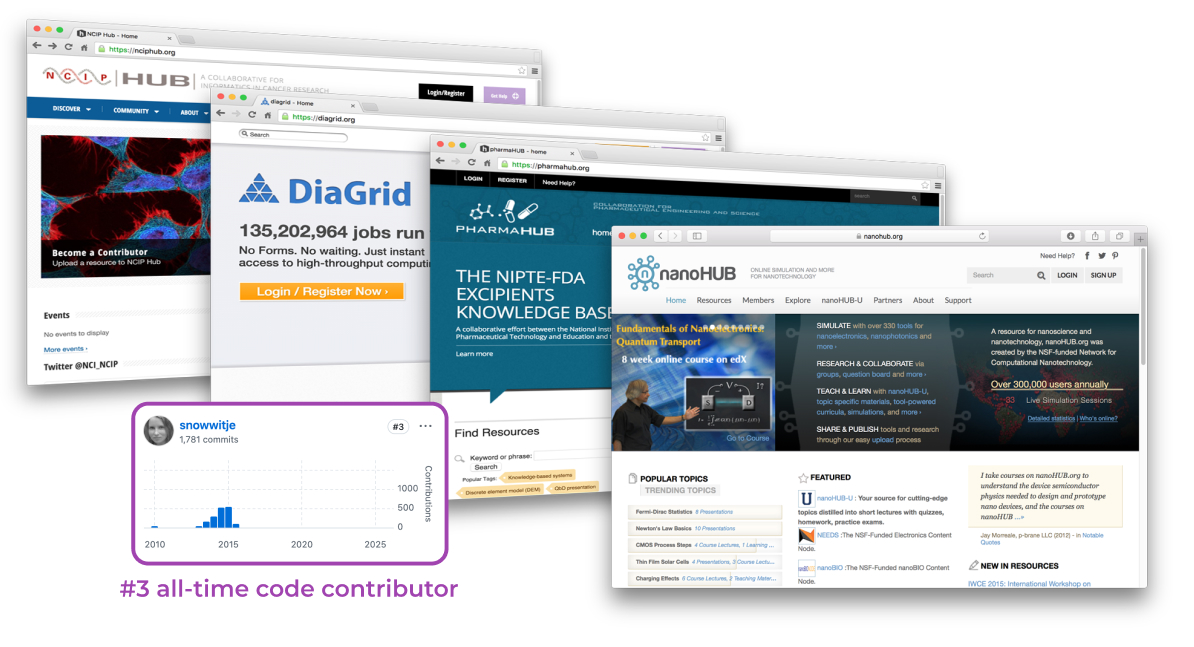
I was the key design and core code contributor (#3 all-time) to Purdue's HUBzero open-source platform for scientific collaboration, delivering its flagship features including the data sharing and publishing solution - Projects.
BackgroundHUBzero is an open source software platform for building powerful websites that support scientific discovery, learning, and collaboration. Such web sites, or "hubs", become a focal point for its user community. The HUBzero platform now supports dozens of hubs across a variety of disciplines, including cancer research, pharmaceuticals, biofuels, microelectromechanical systems, climate modeling, water quality, volcanology, and more.
HUBzero on Github: https://github.com/hubzero | My commits: snowwitje
My WorkMy work on the HUBzero platform included designing and developing the core data sharing and publishing solution - Projects - that allows teams to share and publish their research data, software, publications and other digital products. I also contributed to the design and development of various other functional components of the platform, including the jobs board, wishlist, a system for simulation tool contributions from user community, a virtual point system to encourage user engagement and more. Some of this work started on nanoHUB.org (prior to 2010) - the oldest nanotechnology-focused hub and parent of the HUBzero platform.
For each functional component my work involved conducting user research, collecting requirements, interactive prototyping, data model design, visual and interaction design, as well as complete front-end (HTML, CSS, JavaScript) and back-end (PHP+MySQL) coding within HUBzero framework.
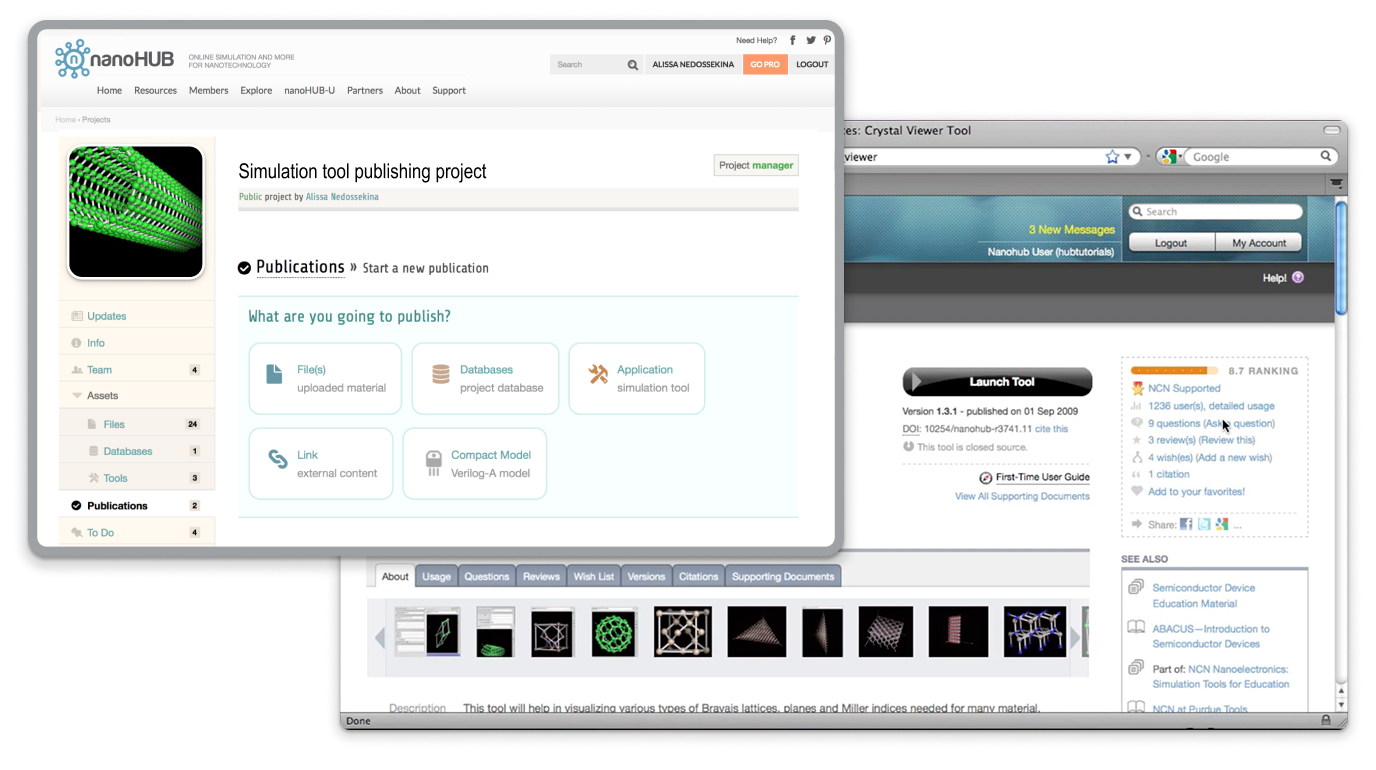
The HUBzero Projects component is a core feature enabling collaborative workspaces, allowing users to share files, manage data, and track progress within a secure, web-based environment. It supports version control, integrates with external file systems like Google Drive or Dropbox, and serves as a space for team collaboration, including file management and publication.
Design Systems
SnowyOwl Design System. 2026 - ongoing
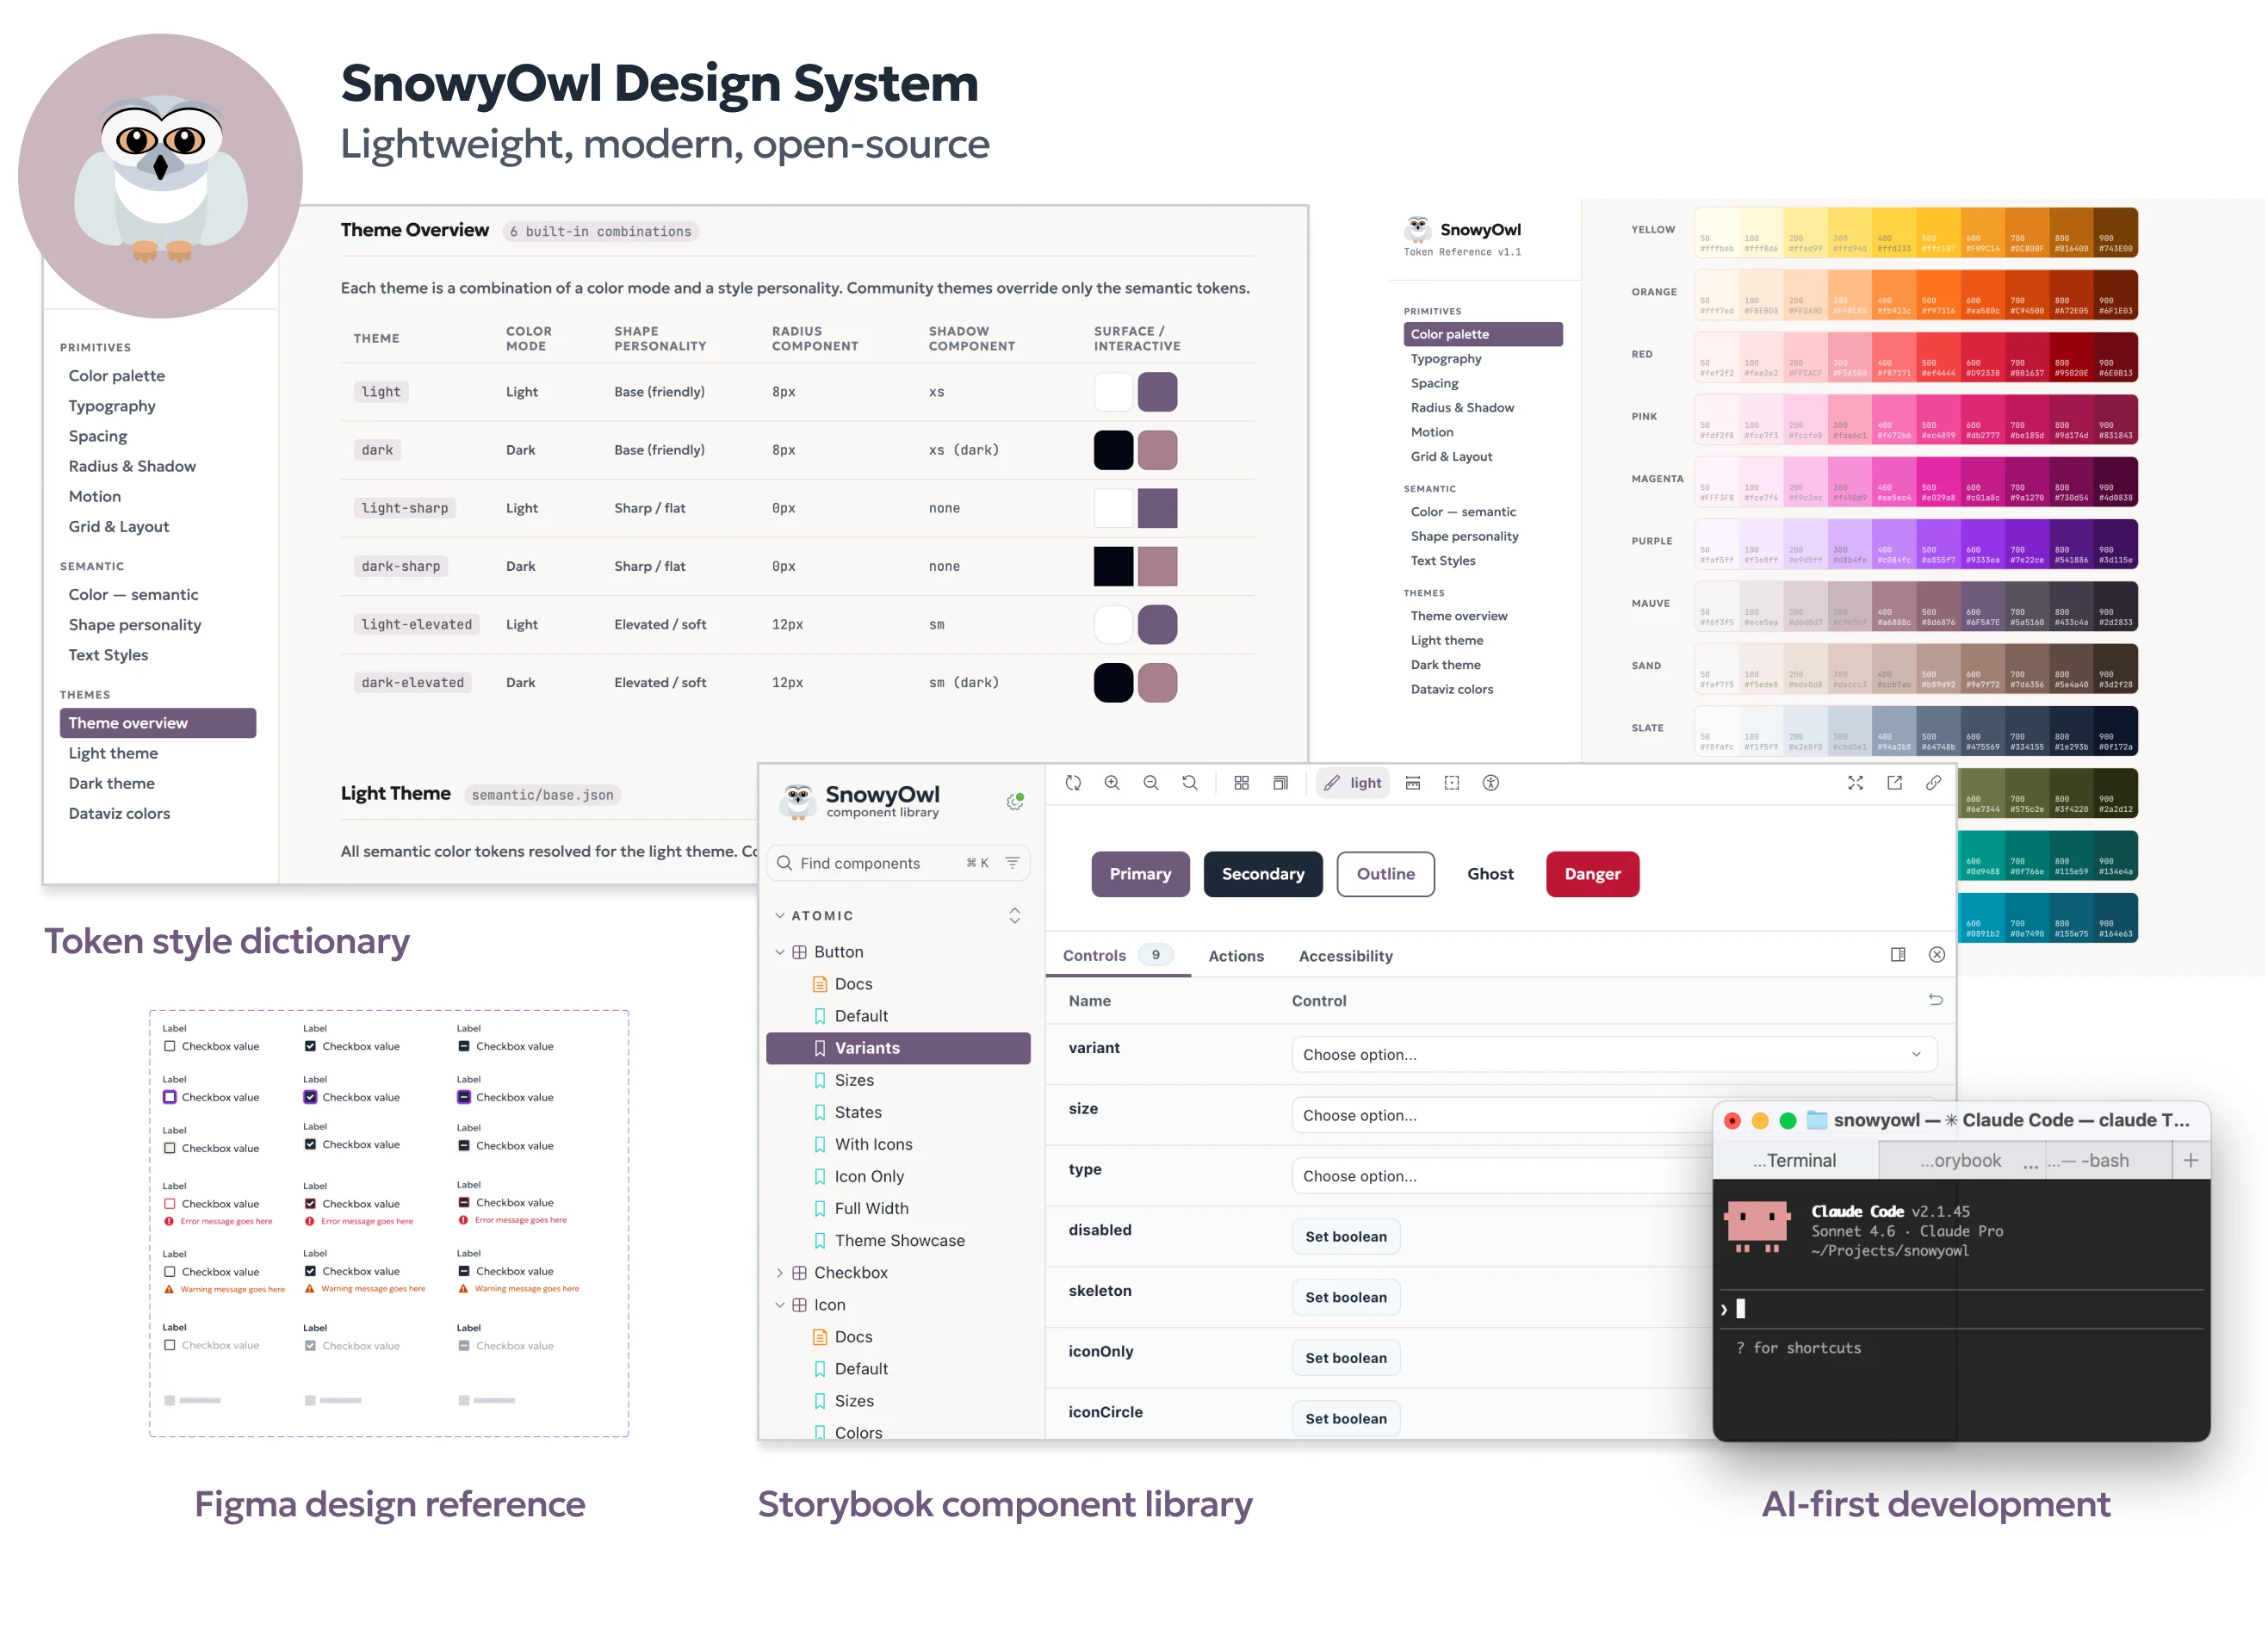
SnowyOwl is an open-source, theme-extensible design system built as framework-agnostic web components using Lit. It is inspired by Carbon Design System in terms of documentation depth and best practices, but designed to be lightweight and community-customizable.
SnowyOwl is my latest project — a comprehensive, modern, lightweight design system built for anyone to use across web and mobile applications. Unlike the platform-specific systems I built previously, including the MDL design system at Molex, SnowyOwl is open source from day one, designed with community access and adaptability at its core. Anyone should be able to drop in a custom theme, override just the tokens they need, and make it their own — without touching the underlying components. I'm building it together with Claude AI as a development partner, which has been its own experiment in how AI collaboration fits into a designer's workflow.
SnowyOwl on Github: https://github.com/snowwitje/snowyowl | Token library: SnowyOwl Tokens
REMEDI platform. REMEDI Design System - published library view. 2018
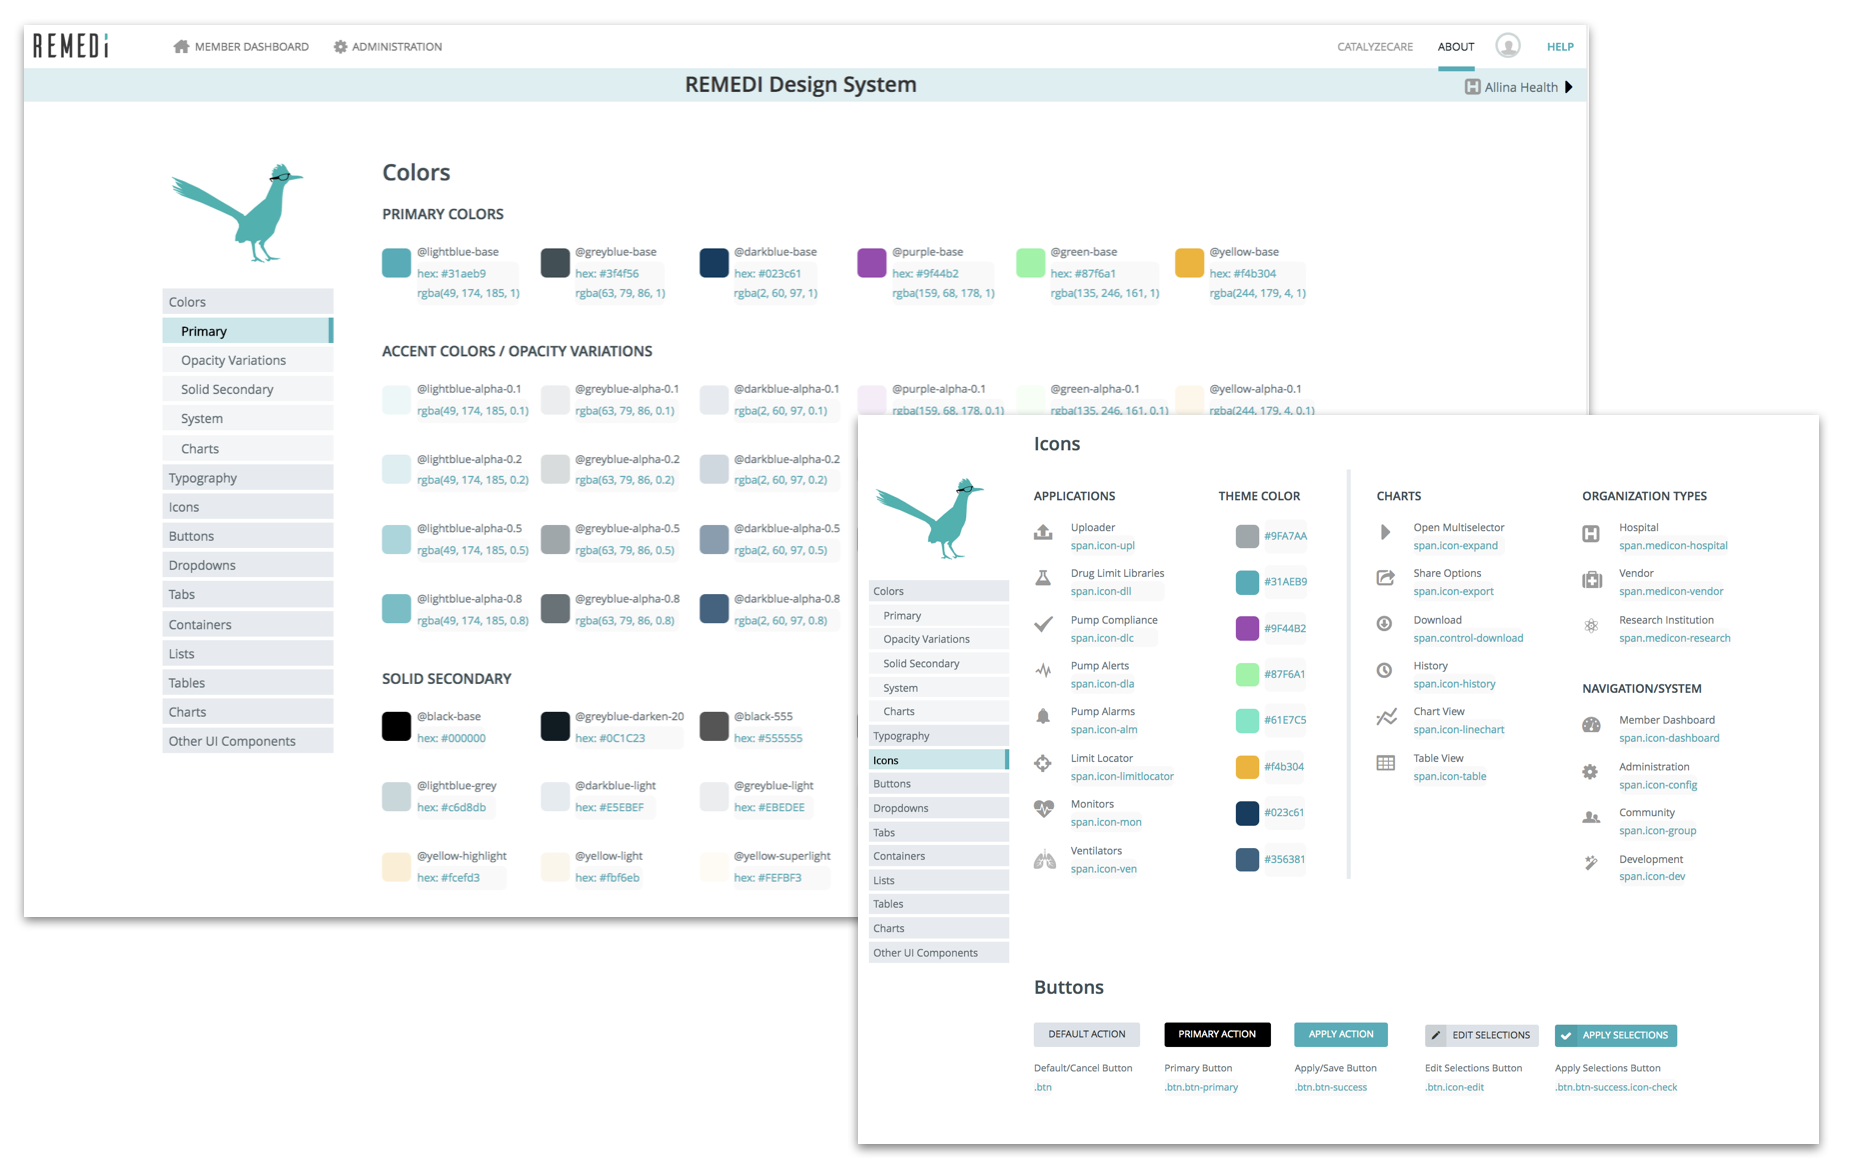
My WorkDeveloped a centralized REMEDI platform design system as a single source of truth for all design elements / tokens, reusable UI components, style guidelines, and documentation that helped streamline the development process and maintain visual consistency across all REMEDI applications.
Design Thinking
OneSciencePlace.org. Running team design thinking sprints.2018
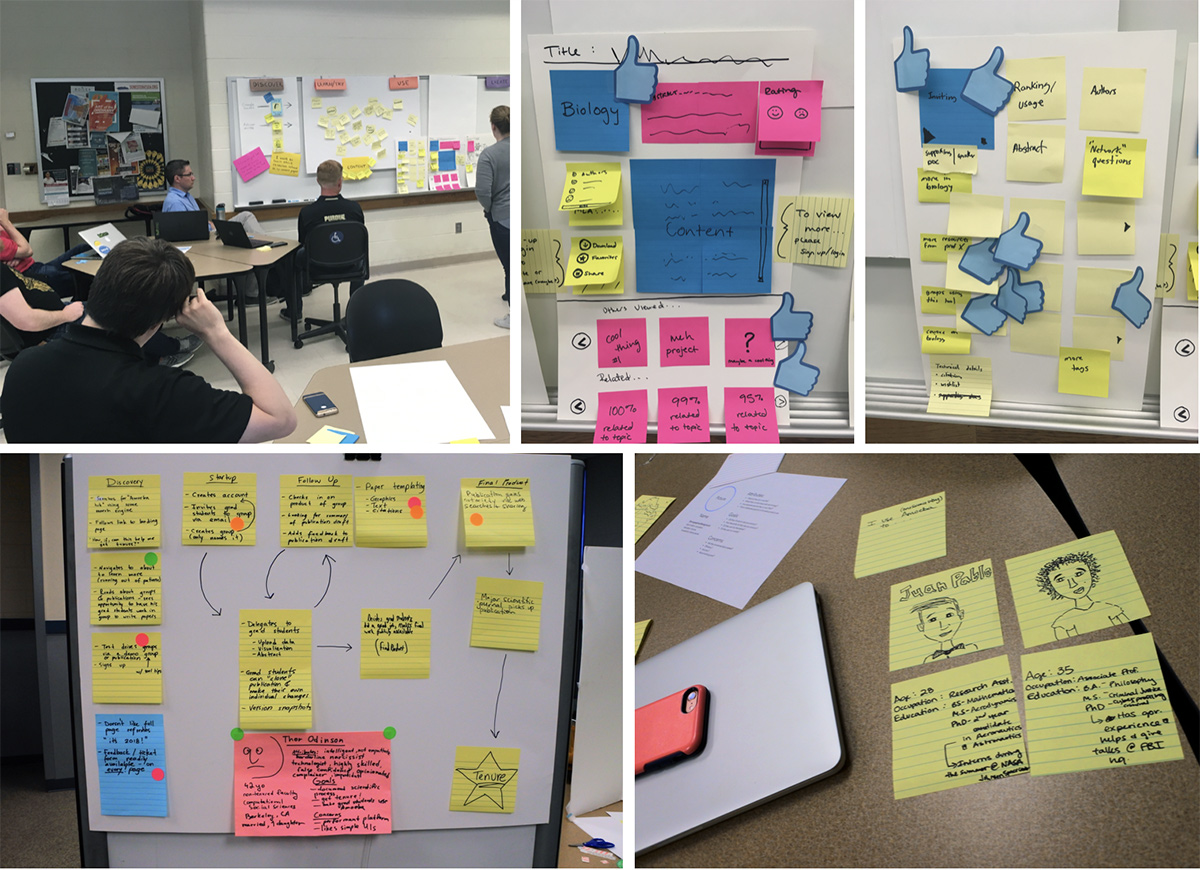
PurposeShape up UX vision for a spin-off of a long-existing technology platform, HUBzero. Align on who will use the new product and why. Bring the whole team (developers, marketers and management) on the same page about product vision, and push for user-centered design.
My WorkOrganized and ran design sprints with the cross-functional team. In the first session the team drew assumption personas and user journeys from what we knew about current users. With user interviews conducted between sessions and insights shared, the second sprint focused on ideation around content discovery feature in the new application. This was a young project. Each sprint sparked ideas to prototype and test, as well as helped identify areas where additional user research was needed.
Prototyping
mPACT2WO platform Digi offering. Screen flow.2019
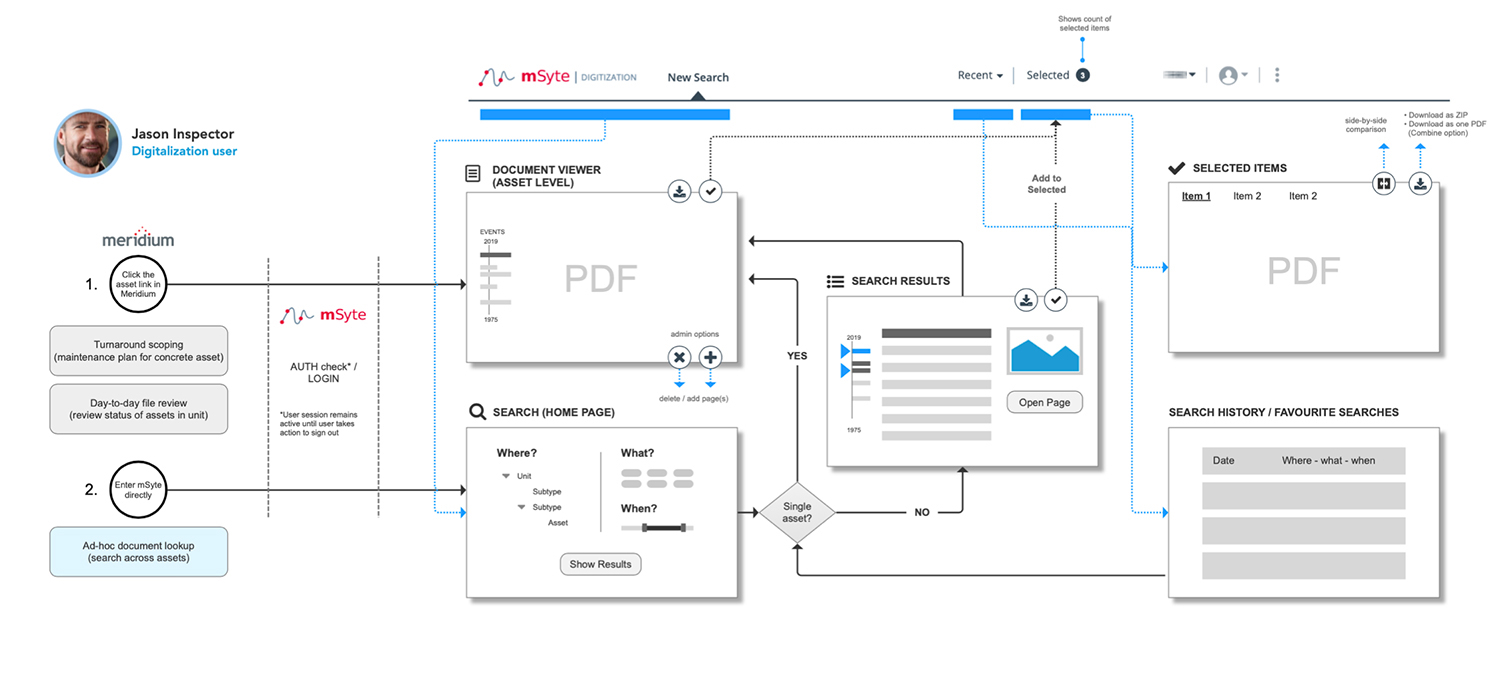
The Digitalization (Digi) web app was part of the mPACT2WO suite of industrial analytics products. It replaced the largely manual process of locating and referencing archived documentation on manufacturing assets for turnaround scoping and other operational decisions. The new web application I designed allowed effective search, browsing and viewing of a vast amount of digitized asset history records.
The screen flow shown was created based on insights captured during user research sessions conducted at a customer location.
Sensorcon Protector app onboarding flow.2022
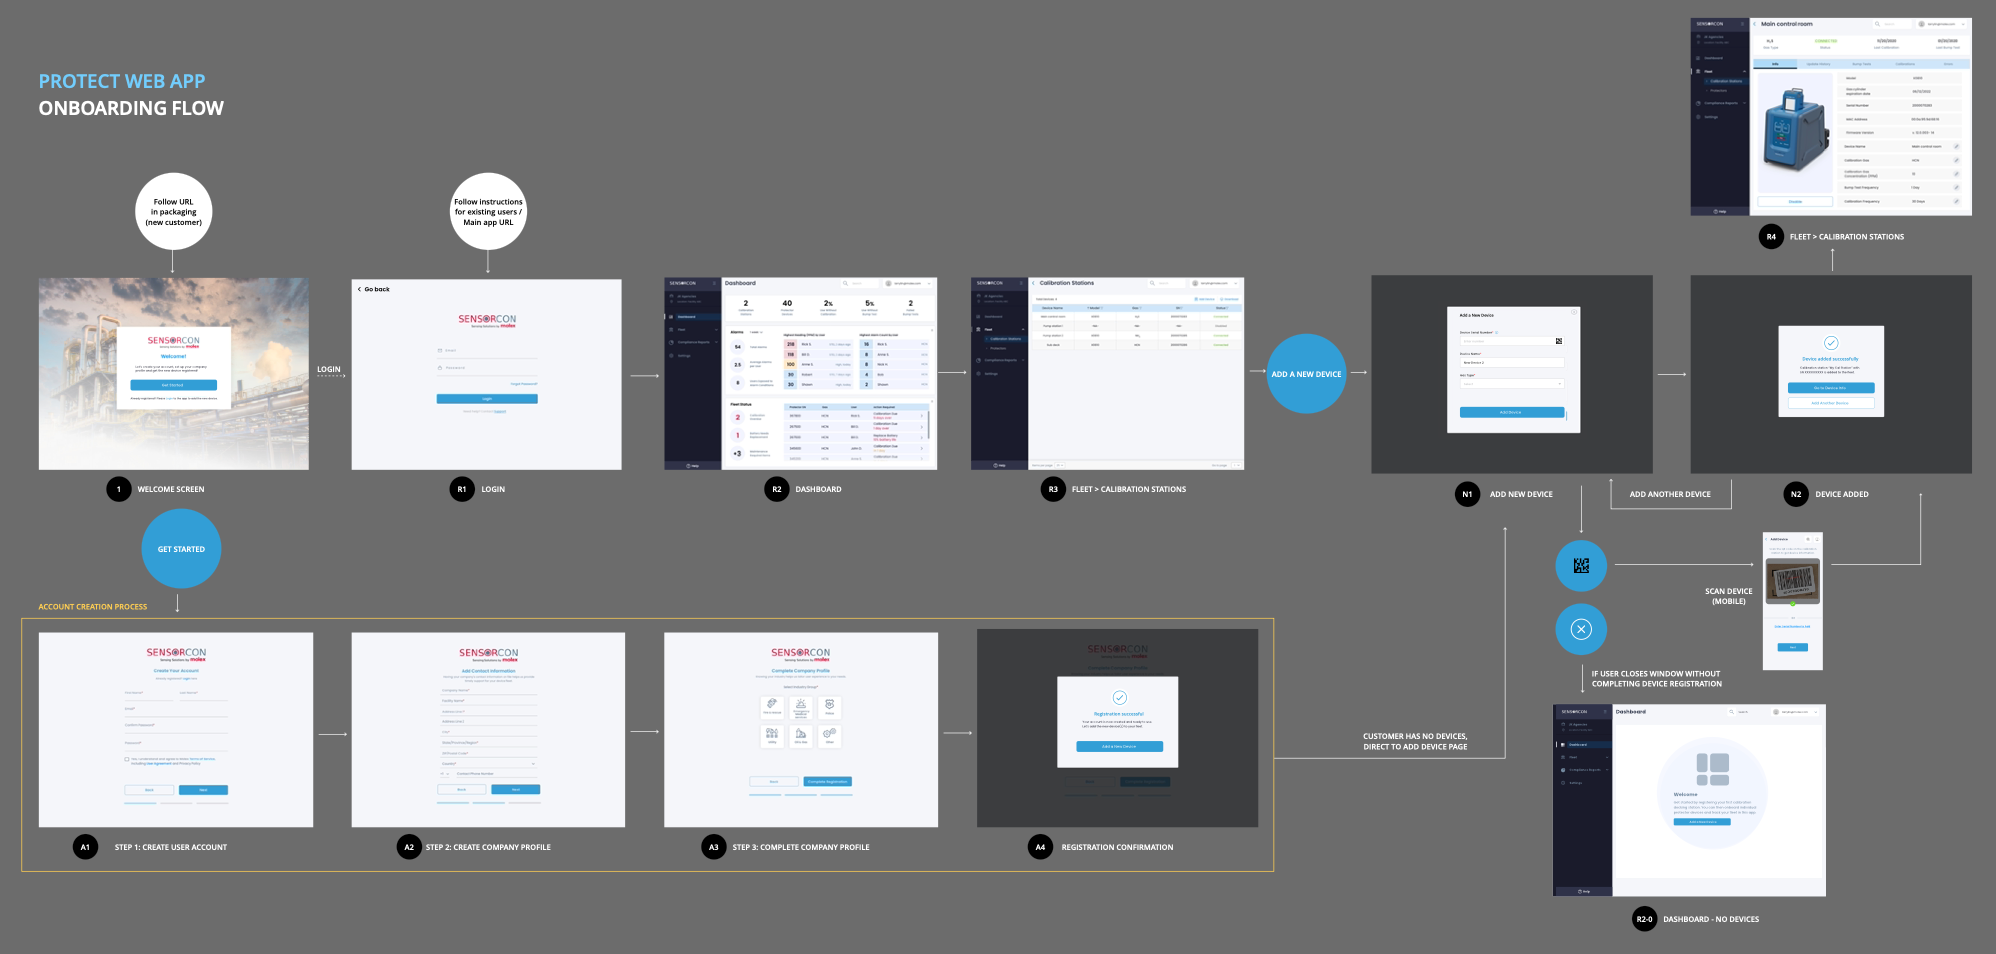
The screen flow represents the device onboarding experience for the Sensorcon Protector app. It guides new users through the initial account creation and enables them to set up a calibration station as part of their device fleet.
Snippets of prototypes for asset health and anomaly detection pilots.2019-2020
A few examples of work on UI prototypes for asset health and anomaly detection pilots in the industrial analytics space during my early tenure at Molex.
REMEDI platform. Early prototyping of the Drug Limit Libraries tool.2015
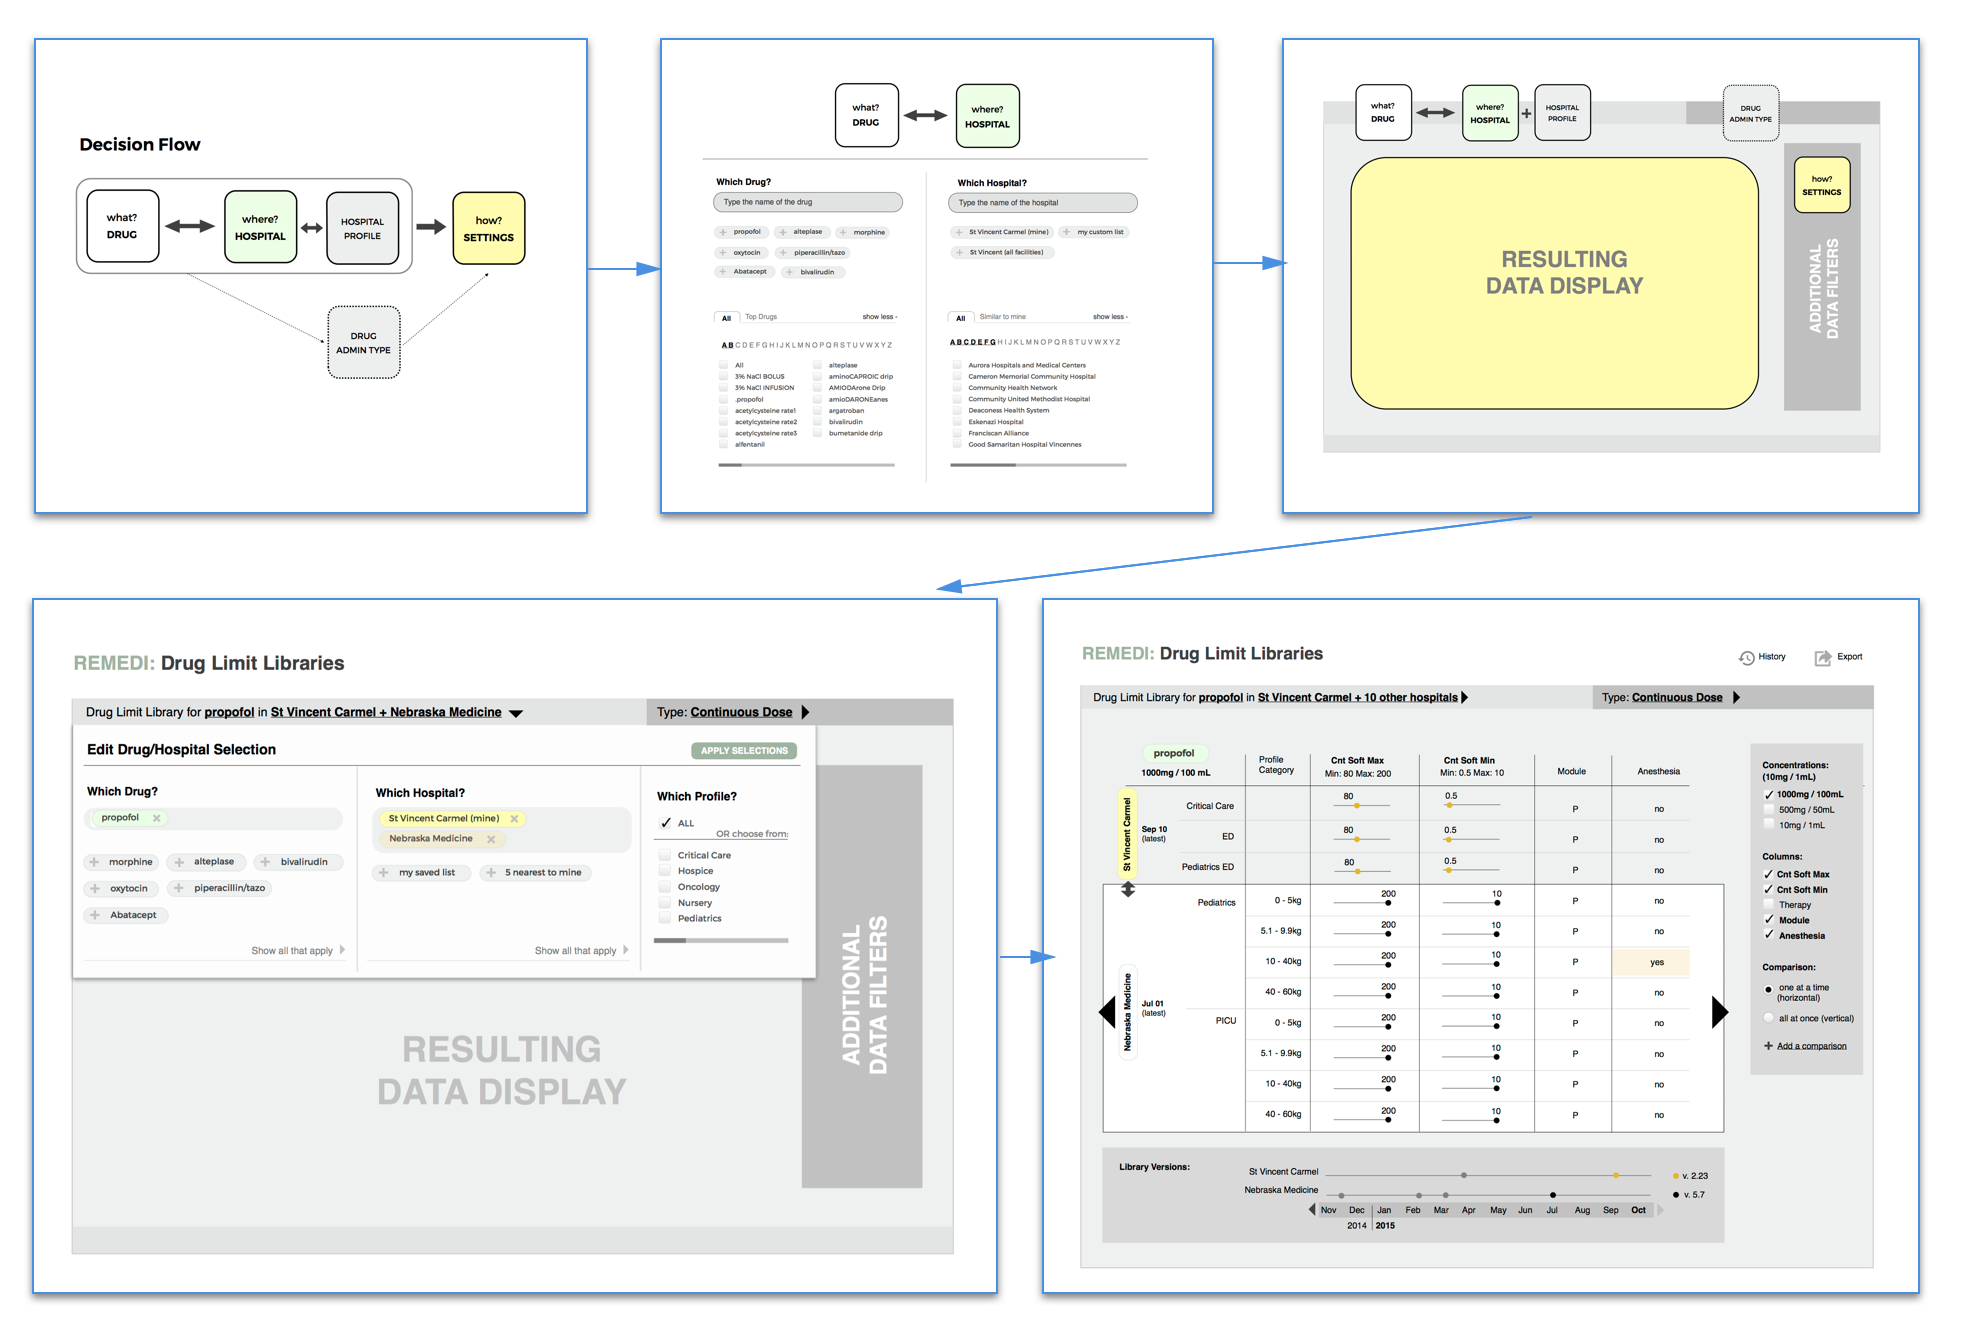
Showing early concepts, ideation sketches feeding into the design of the Drug Limit Libraries tool. Learn the full story of the app design process.
My work involved analyzing available device data and user survey responses as to what questions they seek to answer with the new analytics tool; sorting out variables and breaking them into dimensions; figuring out the user flow, information layout and best interaction patterns to allow effective data analysis and comparison.
REMEDI Project. Alarms app user decision flow.2018

The flow chart represents the pathway of users of Alarms analytics tool from research question (known or unknown) to the answer. The chart considers different questions the user may ask in the process of data analysis. This diagram helped me figure out navigation and UI controls arrangement during early prototyping of Alarms UI.
Game Design
Generation Nano project - game-based nanotechnology education site designed for K12 students.2007
Click on individual thumbnails for screenshots and explanation.
UsersMiddle school kids and their science teachers.
User GoalsLearn and teach basic nanotechnology concepts.
Site ConceptWhen visiting the project website, children find themselves in the lobby of the Birck Nanotechnology Center at Purdue University. They explore the virtual hallways, cleanroom and labs, meet various researchers, and engage in different tasks or "missions" in which they help a researcher and learn about nanotechnology in the process. Each successful mission is rewarded with a key, which could be used to unlock other, more advanced missions.
My WorkConcept, visual and interaction design. Flash UIs and ActionScript programming of all interaction and gaming activities.
Worked closely together with an instructional designer, graduate students and subject matter experts on Purdue campus to develop content and activities for the project.
Digital Marketing
Air Canada. E-marketing.2003-2004
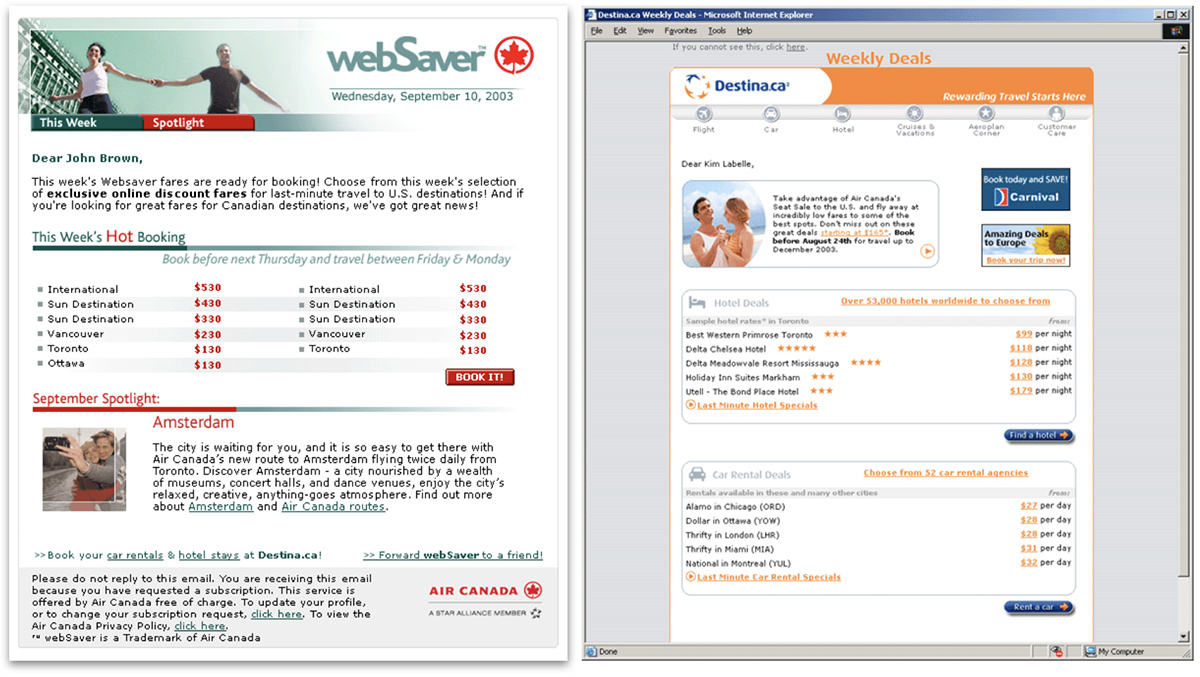
Designed and maintained AirCanada's e-marketing materials, including webSaver and onAir e-newsletters. Created web graphics (headers, buttons, icons etc.) and HTML layouts using Photoshop and Dreamweaver. There was a lot of photo-retouching involved, so this job helped me sharpen my Photoshop skills.
Ensemble Travel Group. E-marketing.2005-2006
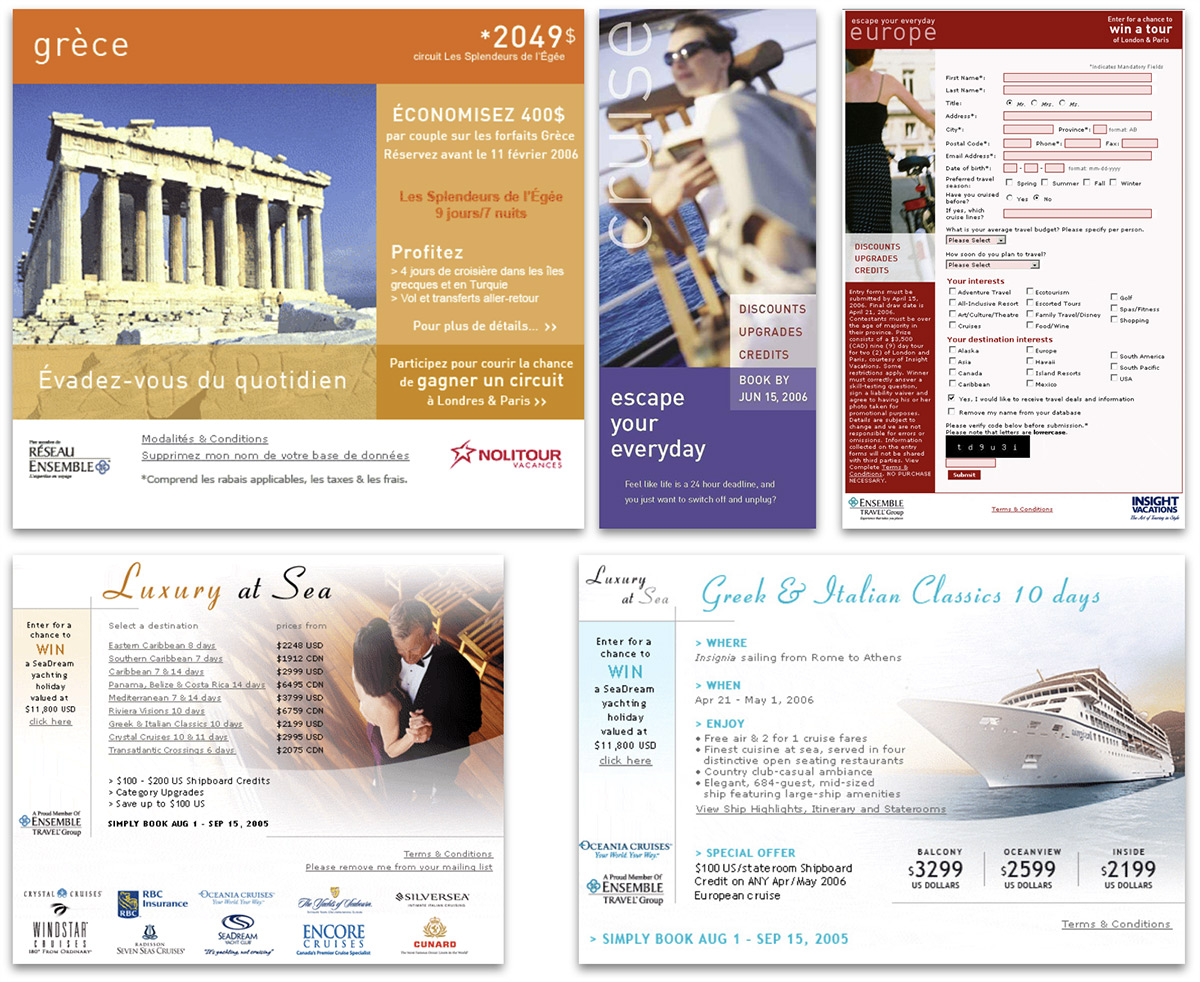
Created web graphics (headers, fonts, buttons, etc.), layouts and HTML/CSS designs for e-ads that were sent to subscribers of travel deals. Used Adobe Photoshop, Dreamweaver. ASP was used for the server side.
Early Web
Air Canada / Destina.ca. Design of hotel search UI.2004
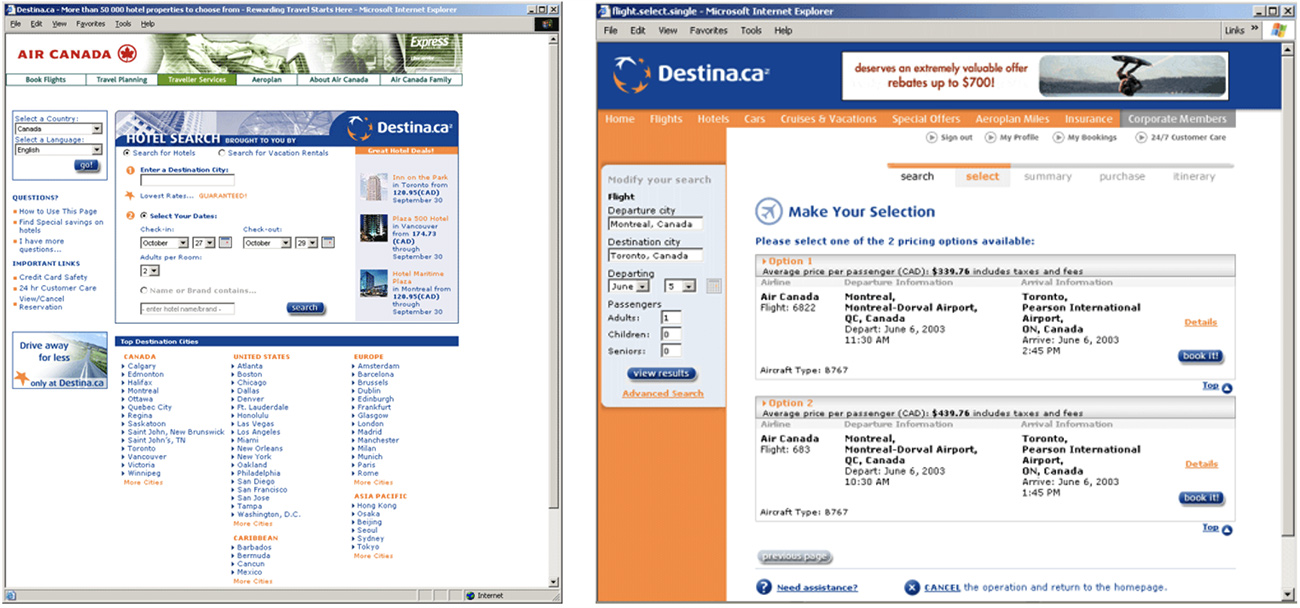
Created web graphics (headers, buttons, icons etc.) and html layouts for the booking engine design revamp of AirCanada.com and partner sites.
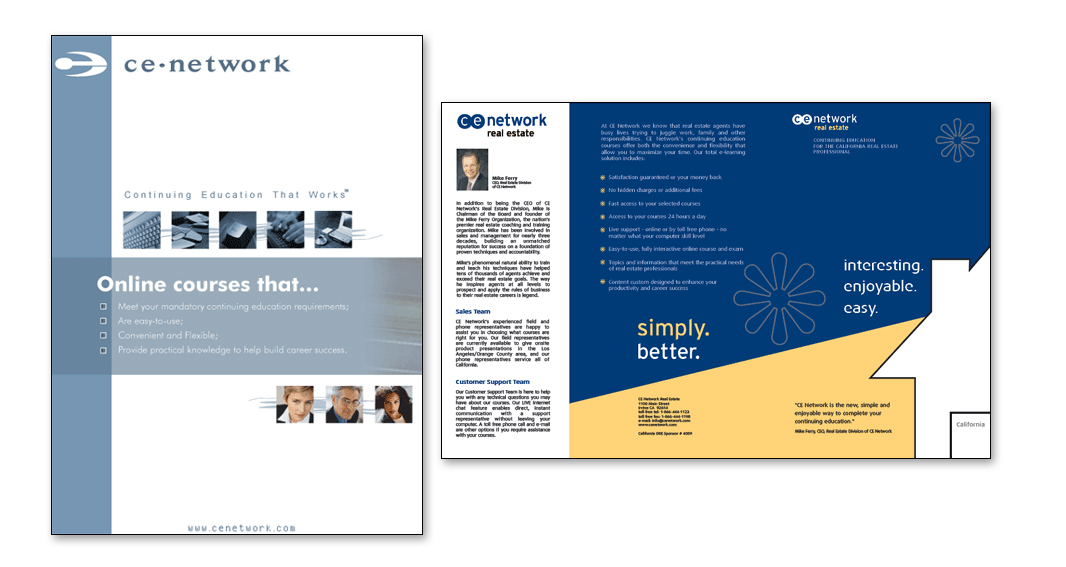
CE Network Inc. Landing pages2002
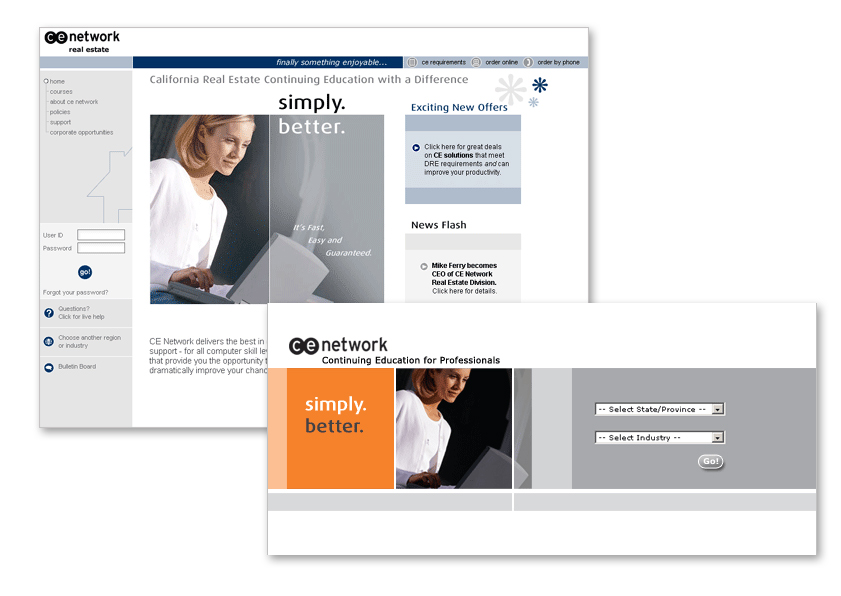
Landing pages for CE Network, the continuing education site (yes! online education back in 2002!) for real estate and financial professionals. Created web pages using Dreamweaver, Photoshop, and Flash.
Peter Brock Architect website (freelance project)2004
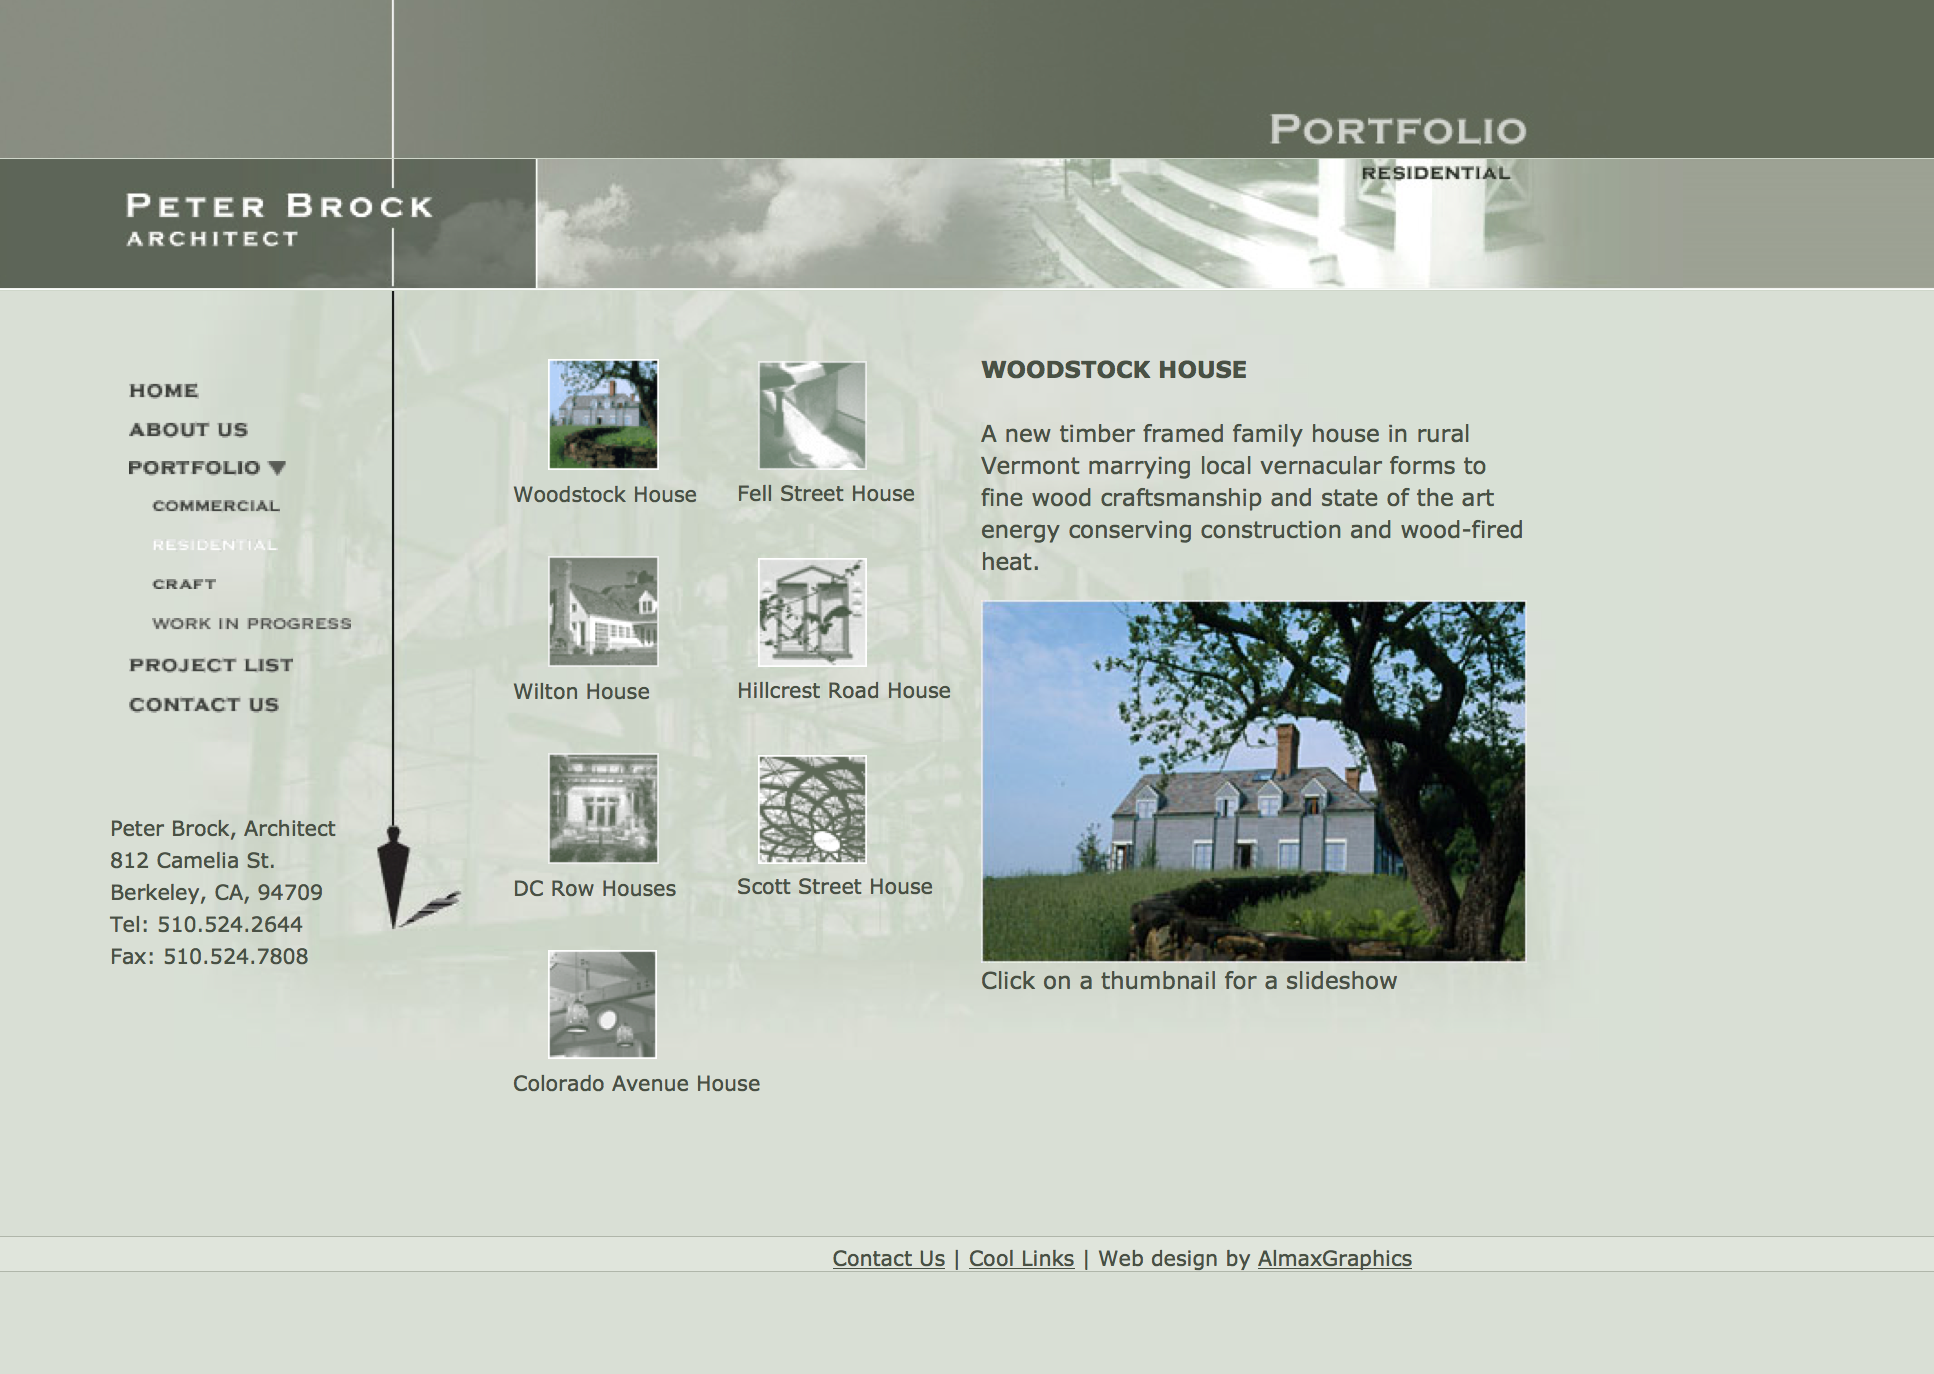
Freelance web design project for a small architecture firm in California. Portoflio site showcasing their residential and commercial architecture projects.
Illustration / Print
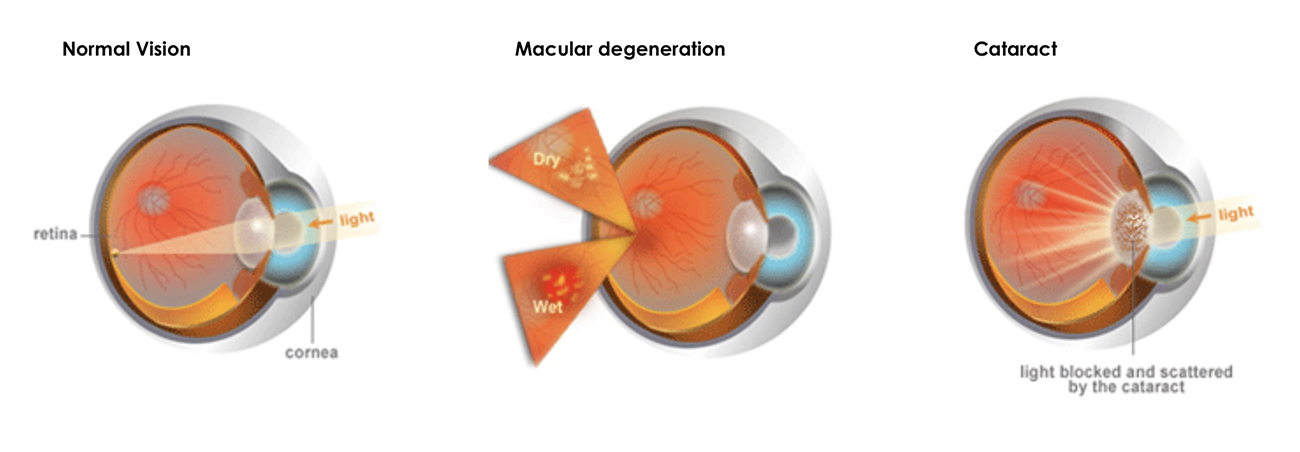
Technical illustration for EyeConX (freelance project).2002
CE Network. Marketing materials. 2002
Mosaic Art
Mosaic art.2004-2010
Click on individual thumbnails to view larger images.
Creatively expressing myself in mosaic art. Materials: Italian and Mexican smalti, millefiori, ceramics and vitreous glass.
Open Web Community
UX mentorship at Mozilla Foundation open web community.2015-2018
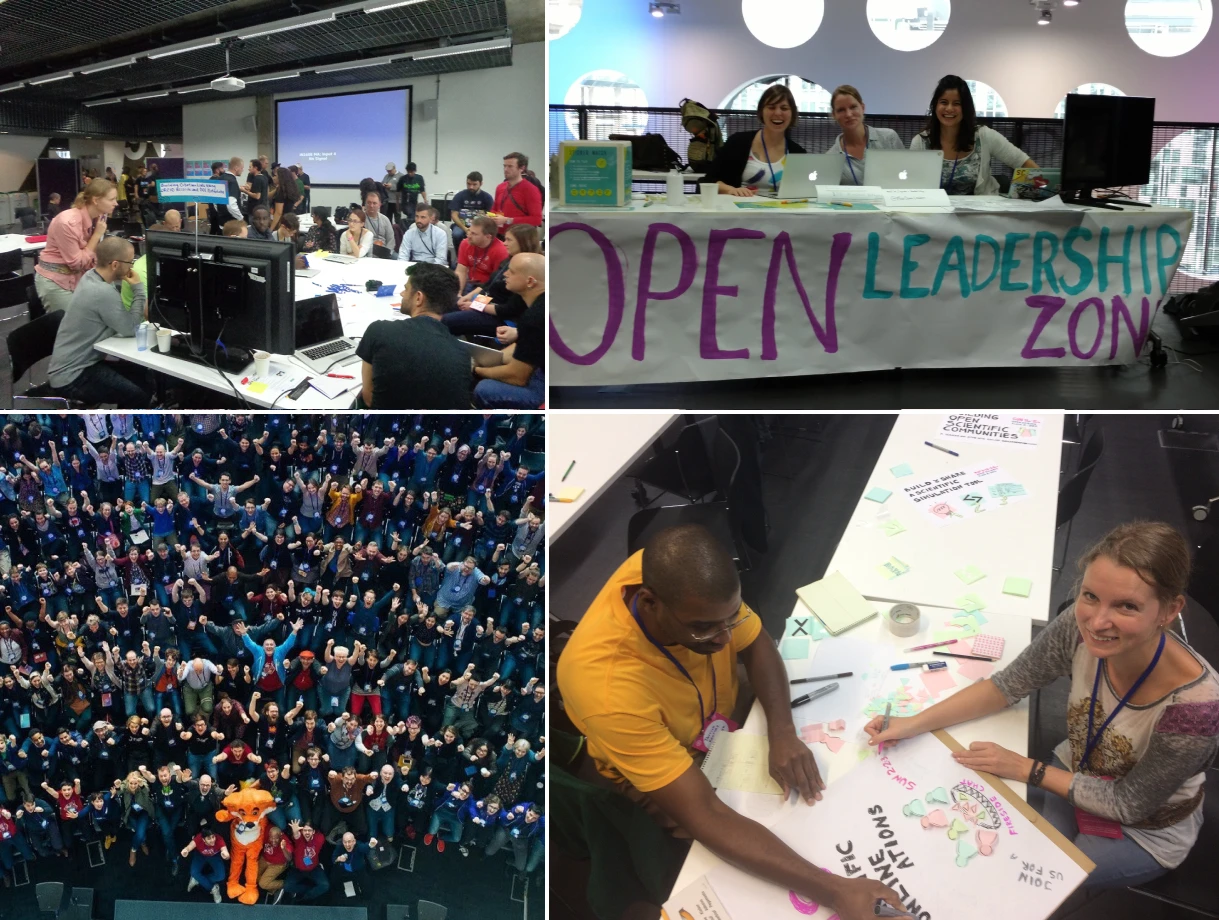
I was an active participant in the Mozilla Foundation's open web community, providing UX mentorship and contributing to various initiatives. In 2015-2018, I served as a mentor and subject expert in User Experience (UX) for the Mozilla Open Leaders program. I also attended the famous Mozilla Mozfest festival in 2015 and 2016 in London, and facilitated sessions on UX Design Challenge in Scientific Software and HUBzero simulation tool HUBzero Workshop Hackathon.